
The September 2026 edition of the Jobs and Skills Australia occupation shortage report has landed, and the headline reads well. The national fill rate rose 2.0 percentage points to 68.1%. If you run recruitment or workforce planning, your board may already be asking why your hardest roles are still open when the report says shortages are easing. The answer sits under the average. Here is how to read the report by skill level and region, and turn it into a hiring plan that holds up.
The headline is easing, your hardest roles are not
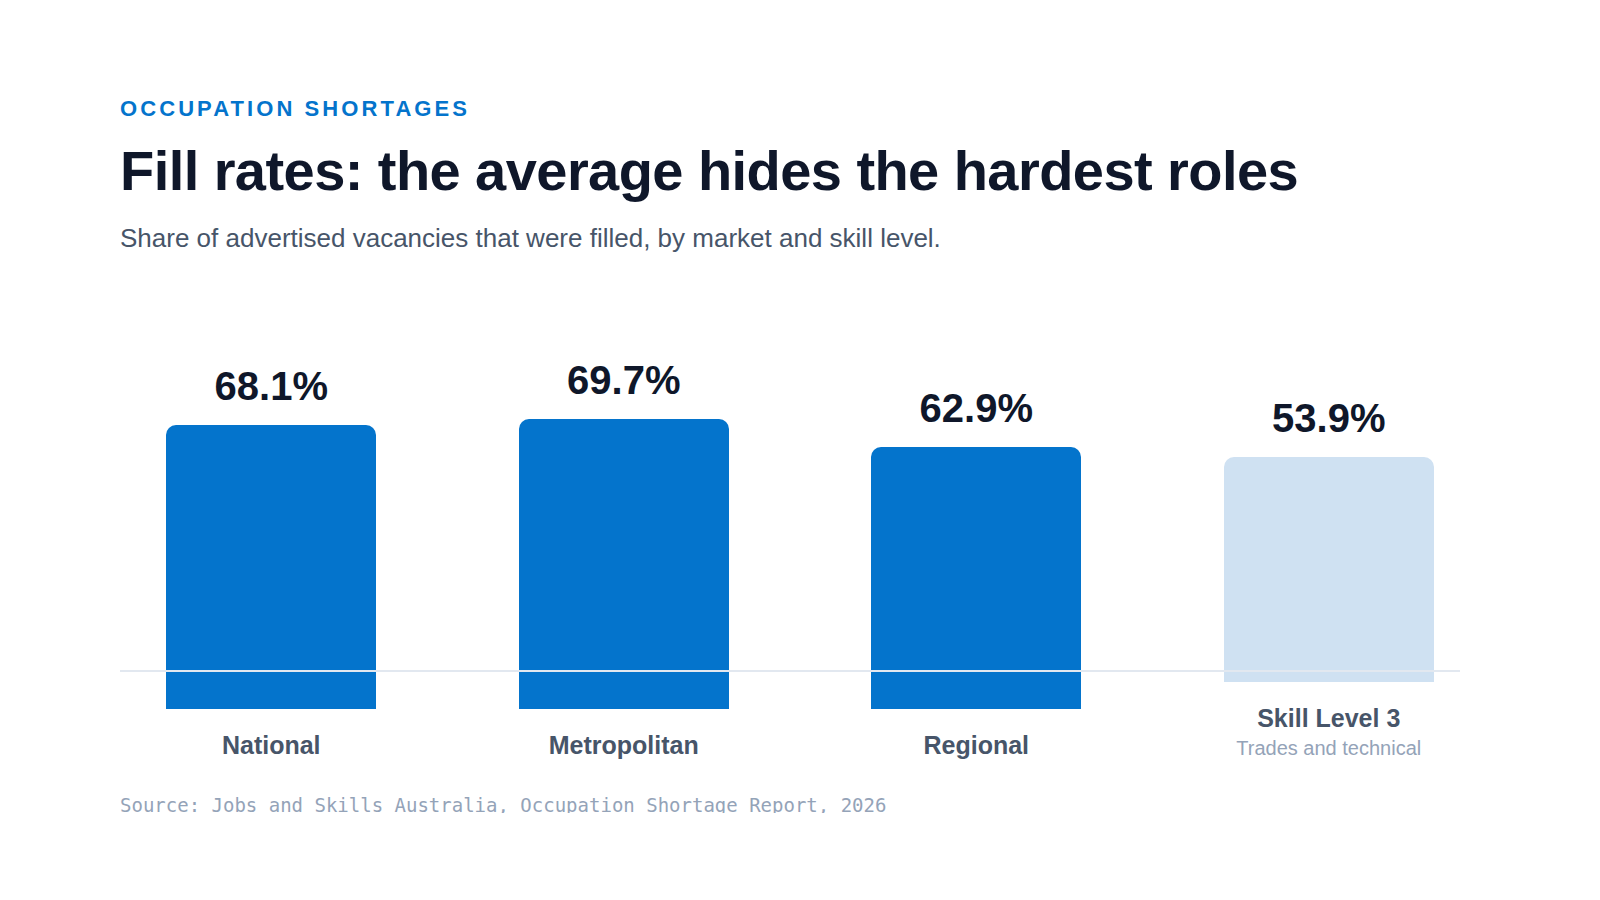
A national fill rate of 68.1% sounds like relief. It measures the share of advertised vacancies that employers managed to fill. Up 2.0 percentage points on the previous read, it points to a labour market that is loosening at the whole-of-country level. That is real, and worth noting. The problem is what the single number hides. Skill Level 3 roles, the trades and technical occupations, are still filling at about 53.9%. Nearly half of those vacancies go unfilled. If your open roles cluster there, the headline is describing someone else's year, not yours.
What the fill rate actually measures
The fill rate is the share of vacancies that were filled, not a count of how many people applied. A role can draw a stack of applications and still be recorded as unfilled if none of the applicants were suitable. Jobs and Skills Australia weighs suitability, not just volume. That distinction matters when you plan. A high applicant count can sit next to a low fill rate, which tells you the shortage is about skills and fit, not about reach. An average across every occupation, region and skill level blurs all of that into one comfortable figure. The value is in the breakdown, not the top line.
Read the occupation shortage report three ways: occupation, skill level, region
Read it three ways and the picture sharpens. By region, metropolitan vacancies filled at 69.7% while regional sat at 62.9%. A gap of nearly 7 percentage points means the same role can be routine to fill in a capital city and stubborn a few hours down the highway. By skill level, Skill Level 3 trades and technical roles are the hardest, at about 53.9%. By occupation, the biggest suitability gaps show up in the very-high-skilled roles: finance, science, design, engineering and ICT. Those are the vacancies where applicants arrive but few clear the bar.
- 68.1%, up 2.0 percentage points
- National fill rate
- 69.7%
- Metropolitan fill rate
- 62.9%
- Regional fill rate
- about 53.9%
- Skill Level 3 (trades and technical)
Map the report onto your own vacancies
A public report is only useful once it touches your own data. Start by tagging each open role with its occupation, its skill level and the region it sits in. Join those tags to the shortage signal from the report. Then put your own time-to-fill next to it. Where a role is filling slower than the national fill rate for its occupation, you have a local problem worth a closer look. Where it is filling faster, you have a strength you can lean on. This is the join that turns a headline into a plan your board can question and still trust.
Turn the read into three sourcing moves
Once each role is mapped, three moves follow.
- Widen the search where the shortage is about reach. If the fill rate is soft but applicants are scarce, the fix is more channels, a broader radius, or remote and hybrid options that pull from metropolitan pools into regional roles.
- Change the offer where the shortage is about fit or competition. For Skill Level 3 trades and the very-high-skilled finance, science, engineering and ICT roles, another job ad rarely helps. Pay, conditions and progression move the needle.
- Build a different pipeline where the market is genuinely thin. Training, relocation support or a contract-to-permanent path can beat a fourth round of advertising for a role the report shows is structurally short.
What to watch next
Expect the national average to keep improving while specific shortages hold. That pattern is the whole point of reading below the top line. Recheck the figures each edition rather than trusting a single read, and pair the report with your own vacancy trend so you can see movement before it shows up nationally. The occupations that are hard today, the trades and the very-high-skilled roles, are unlikely to loosen quickly. Plan as if they will stay tight and adjust down if the evidence changes.
Plan off the breakdown, not the average
The occupation shortage report gives you a fair national read and a set of warnings underneath it. Take the warnings. A rising fill rate does not mean your Skill Level 3 vacancies in a regional town got easier. Plan off the breakdown that matters to your roles, and you resource sourcing for the gaps that are actually widening. If you want that breakdown built against your own vacancy data, see how SkillsMap maps your roles against the shortage data at /subs-services/skillsmap.
Sources
- Jobs and Skills Australia, Occupation Shortage Report (accessed 2026-09-09)