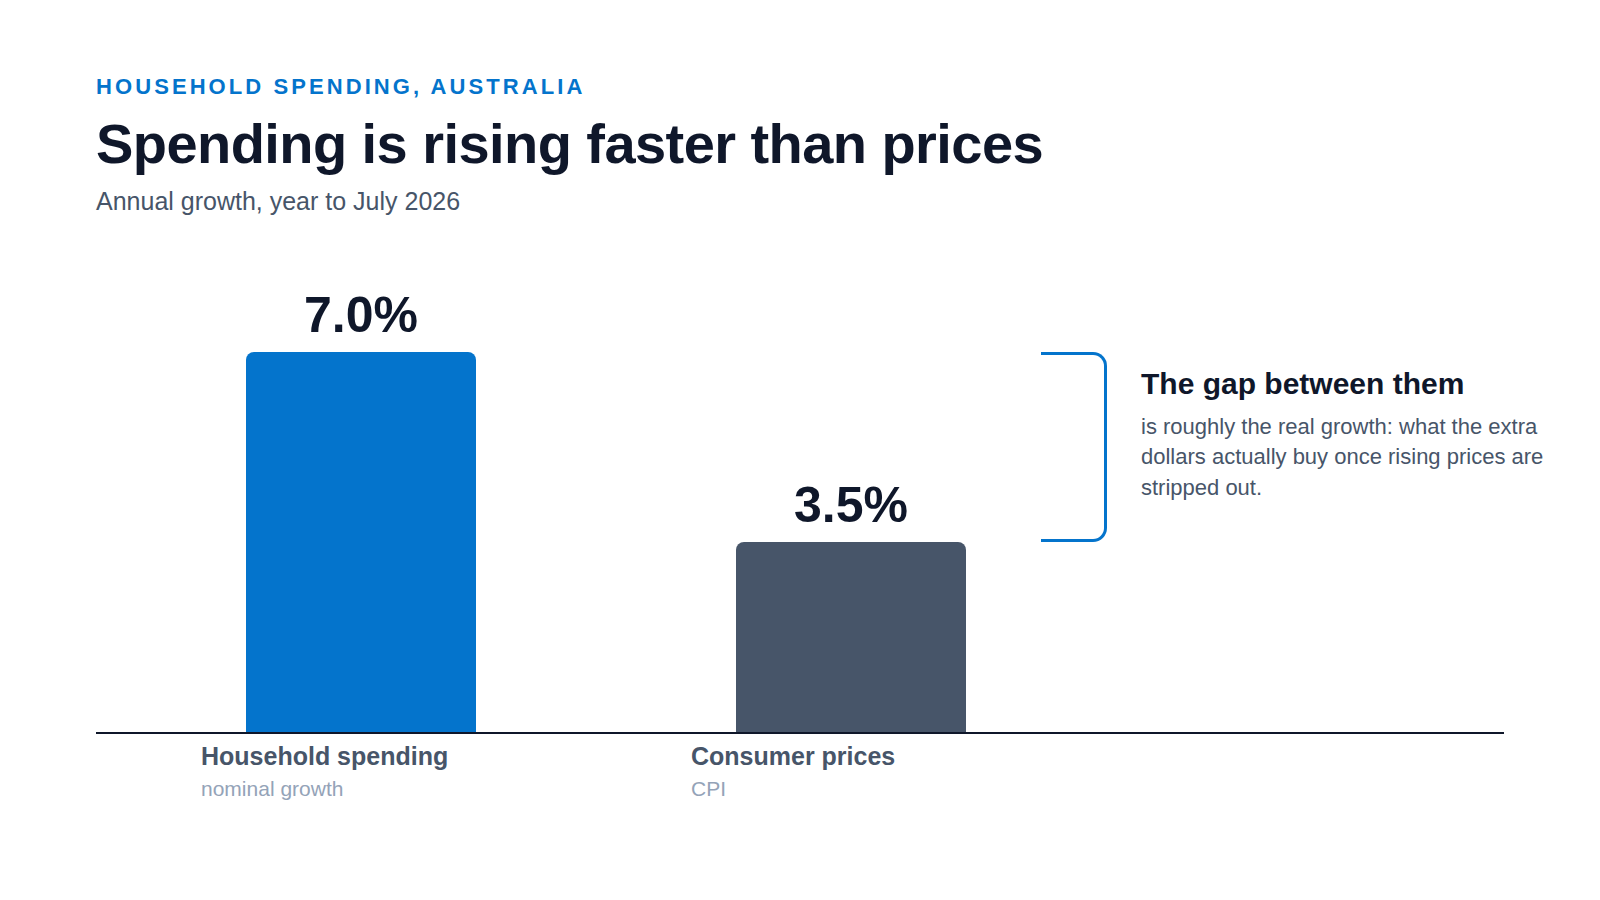
Your monthly sales line is up and the year looks solid. Then a national number gives you pause: household spending rose 7.0 per cent over the year to July 2026, while prices rose 3.5 per cent over the same period. So how much of your own growth is real extra demand, and how much is just higher prices passing through? With spring and the Christmas run ahead, that answer decides how much stock you buy and how many shifts you roster. Here is how to read the figures and apply them to your own sales.
What the July 2026 household spending numbers say
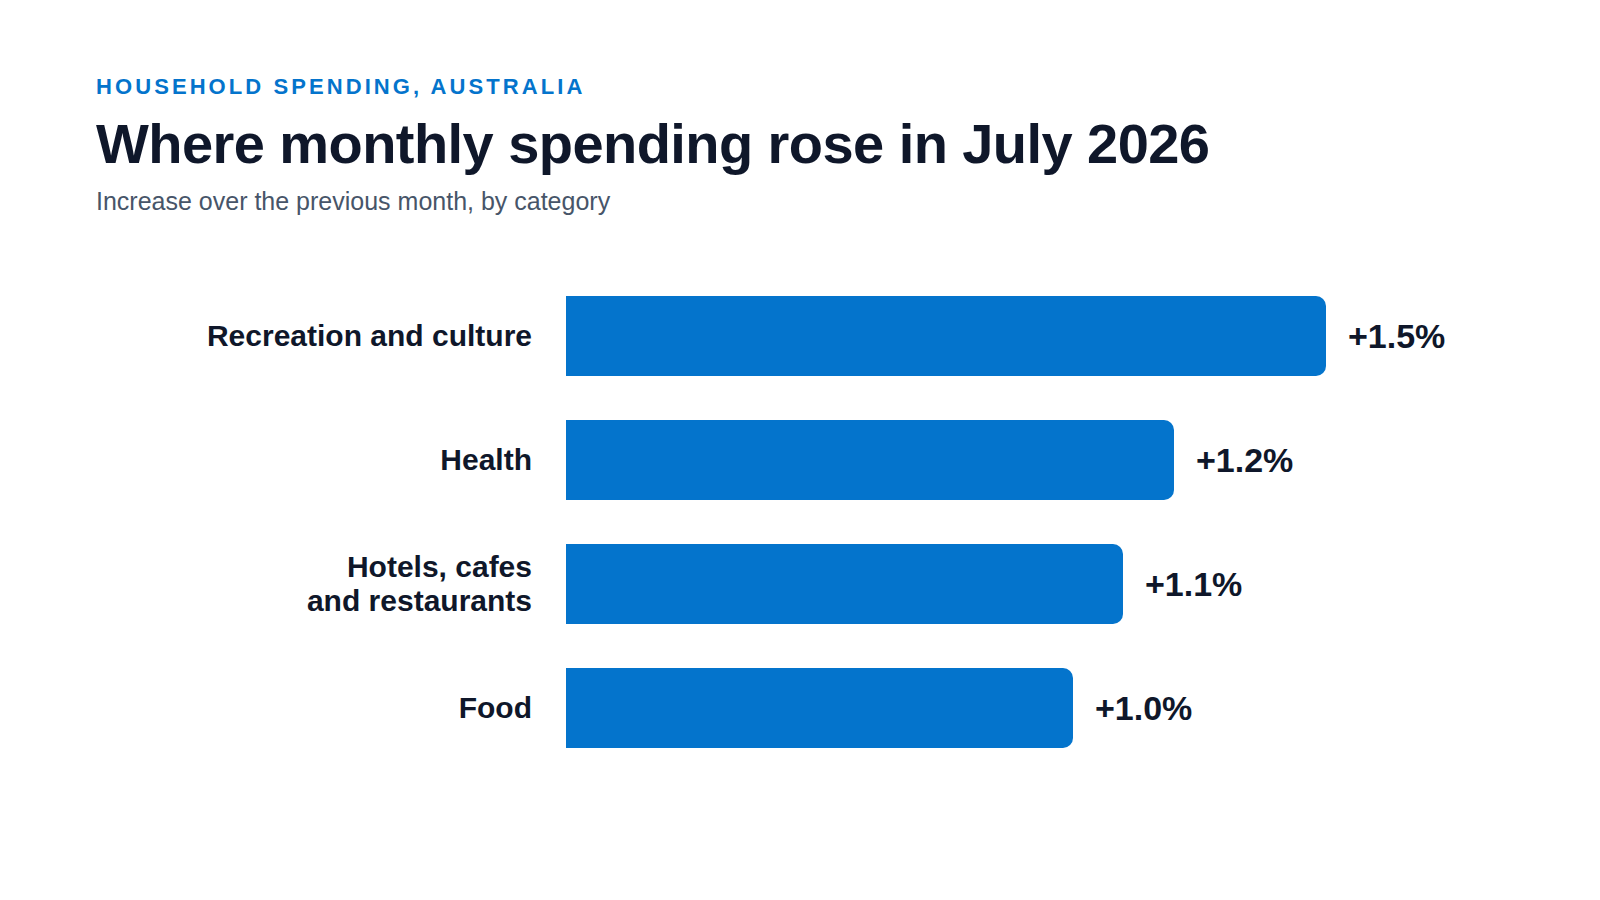
The ABS Monthly Household Spending Indicator for July 2026 was released on 27 August. Spending rose 1.1 per cent in the month, seasonally adjusted. That followed a rise of 1.0 per cent in June and 1.2 per cent in May, so July was the third monthly rise in a row. Over the year, nominal household spending was 7.0 per cent higher than the same time last year, the highest annual growth since June 2023. Four categories led the July rise: recreation and culture up 1.5 per cent, health up 1.2 per cent, hotels, cafes and restaurants up 1.1 per cent, and food up 1.0 per cent.
This was the third consecutive monthly rise in household spending, led by Recreation and culture, Food, Hotels, cafes and restaurants, and Health.
- +1.1%
- Household spending, July 2026 (monthly)
- +7.0%
- Household spending, year to July 2026 (nominal)
- +3.5%
- CPI, year to July 2026
- +0.4%
- GDP, June quarter 2026
Nominal is not real: subtract the price effect
That 7.0 per cent is a nominal figure. It mixes two different things: people buying more, and people paying more for the same thing. To see real growth, you need to strip out prices. Over the same year to July 2026, the ABS Monthly CPI Indicator rose 3.5 per cent. Set the two side by side and the picture changes. A large part of the headline rise is price, not extra volume. The gap between the two is the part that looks like real growth, and it is a lot smaller than 7.0 per cent.
Split your own revenue into price and volume
You can run the same split on your own numbers. Revenue is price multiplied by quantity, so a rise in revenue comes from higher prices, higher volume, or both. The arithmetic is simple once you have two things: your average selling price and your unit count for each period.
- Pick a sales line and two comparable periods, for example July this year and July last year.
- Work out the average selling price for each period: revenue divided by units sold.
- Compare unit counts to see the volume change, and compare average prices to see the price change.
- If revenue is up but units are flat, your growth is price. If units are up too, some of it is real.
Benchmark your category, not just the total
The national total hides big differences between categories. In July 2026, recreation and culture rose 1.5 per cent, health rose 1.2 per cent, hotels, cafes and restaurants rose 1.1 per cent, and food rose 1.0 per cent. Your business sits in one of these, not in the average. Compare your growth against the right category, not the headline. If your category grew 1.0 per cent and you grew faster, you are winning share. If you grew in line with it, you are riding the tide.
The demand backdrop: cautious households
Read the spending rise against the wider economy. GDP grew just 0.4 per cent in the June quarter 2026, and 2.1 per cent through the year. The household saving ratio sat at 6.5 per cent, and household consumption grew 0.4 per cent in the quarter. Households are still careful with money. That is a reason to plan volume conservatively rather than assume the 7.0 per cent headline means a spending boom.
Economic growth remained subdued in the June quarter as households continued to behave cautiously.
The four tiles to put on the dashboard
You do not need a big report to act on this. Four tiles, refreshed from the ABS release each month, keep the question in front of owners and the board.
- Real growth: your revenue growth with the price effect stripped out, so you see volume.
- Price versus volume: the split of your revenue change into the two parts.
- Category benchmark: your growth against your ABS category, not the national total.
- Cautious-demand context: GDP and the saving ratio, so nobody over-plans on a nominal number.
Plan spring on volume you can actually see
Before you commit to spring stock, rosters and cash, split your revenue into price and volume and check it against your category. A 7.0 per cent national rise is encouraging, but a good chunk of it is prices, and households are still cautious. Plan for the volume you can actually see, not the volume the headline implies. If you want the four tiles built and kept current for you, visit the KPI Tracker page at /subs-services/kpi-tracker.
Sources
- Household spending rises for third month in a row (ABS Monthly Household Spending Indicator, July 2026) (accessed 2026-09-10)
- CPI rose 3.5% in the year to July 2026 (ABS Monthly CPI Indicator) (accessed 2026-09-10)
- Australian economy grew 0.4% in the June quarter (ABS National Accounts) (accessed 2026-09-10)