Busy, but the money is not landing
Your revenue looks steady. Order counts hold up. Yet the business feels like it is working harder for less. That feeling now has numbers behind it: a profit margin squeeze, where costs rise faster than the prices you can charge. In August 2026, NAB reported that business conditions turned negative for the first time in six years. The cause was not weak demand. It was margins.
The demand story is actually fine. The ABS put household spending up 7.0% through the year to July 2026, and up 1.1% for the month. National output grew 0.4% in the June quarter. So people are still buying. The trouble sits between the sale and the profit: what it costs to deliver the work is climbing faster than what you can bill for it.
What the August numbers actually say
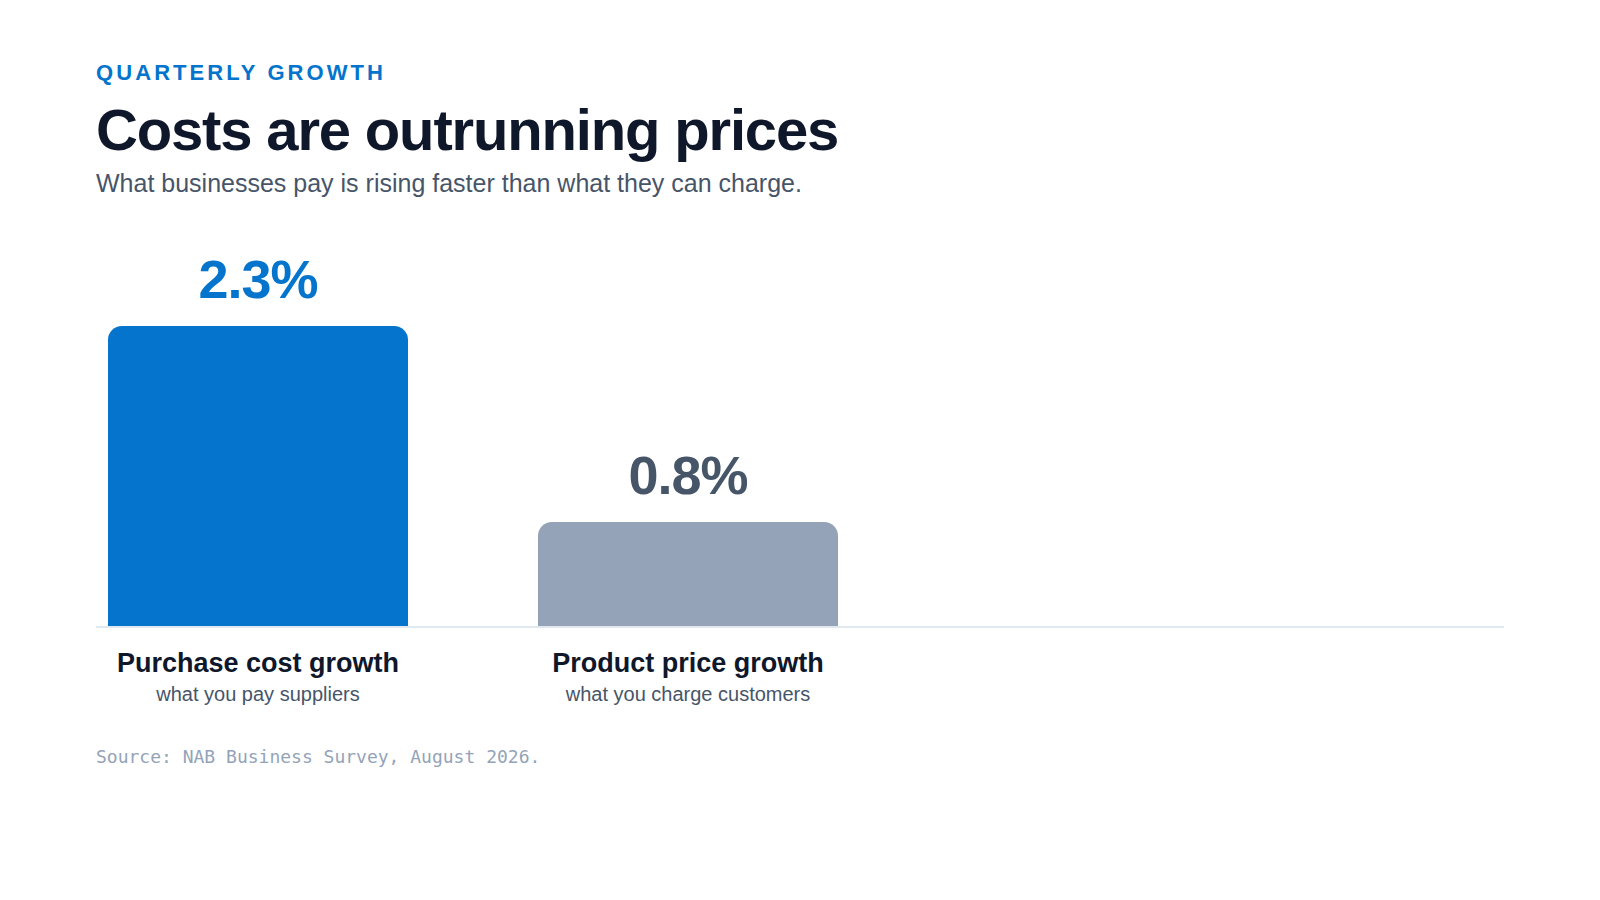
NAB's headline conditions index fell 5 points to -1, its first negative reading in six years. Confidence dropped to -8. Profitability took the hardest hit, down 10 points to -9. The reason is in the input and output prices. Purchase cost growth ran at 2.3% in quarterly terms, while final product price growth was just 0.8%. In NAB's words, cost growth has been running well ahead of product price growth for almost six months.
- -1 index points
- Business conditions, August 2026
- -9 index points
- Profitability, August 2026
- 2.3%
- Purchase cost growth (quarterly)
- 0.8%
- Product price growth (quarterly)
Why a revenue-only dashboard hides the profit margin squeeze
Here is the blind spot. Revenue and order counts can rise while margin quietly falls. If your dashboard only shows the top line, a bad month can look like a good one until the accounts arrive. NAB's forward orders index sat at 0 in August, so the pipeline was flat, not booming. A business can be just as busy as last quarter and keep less of every dollar, and nothing on a revenue tile would tell you.
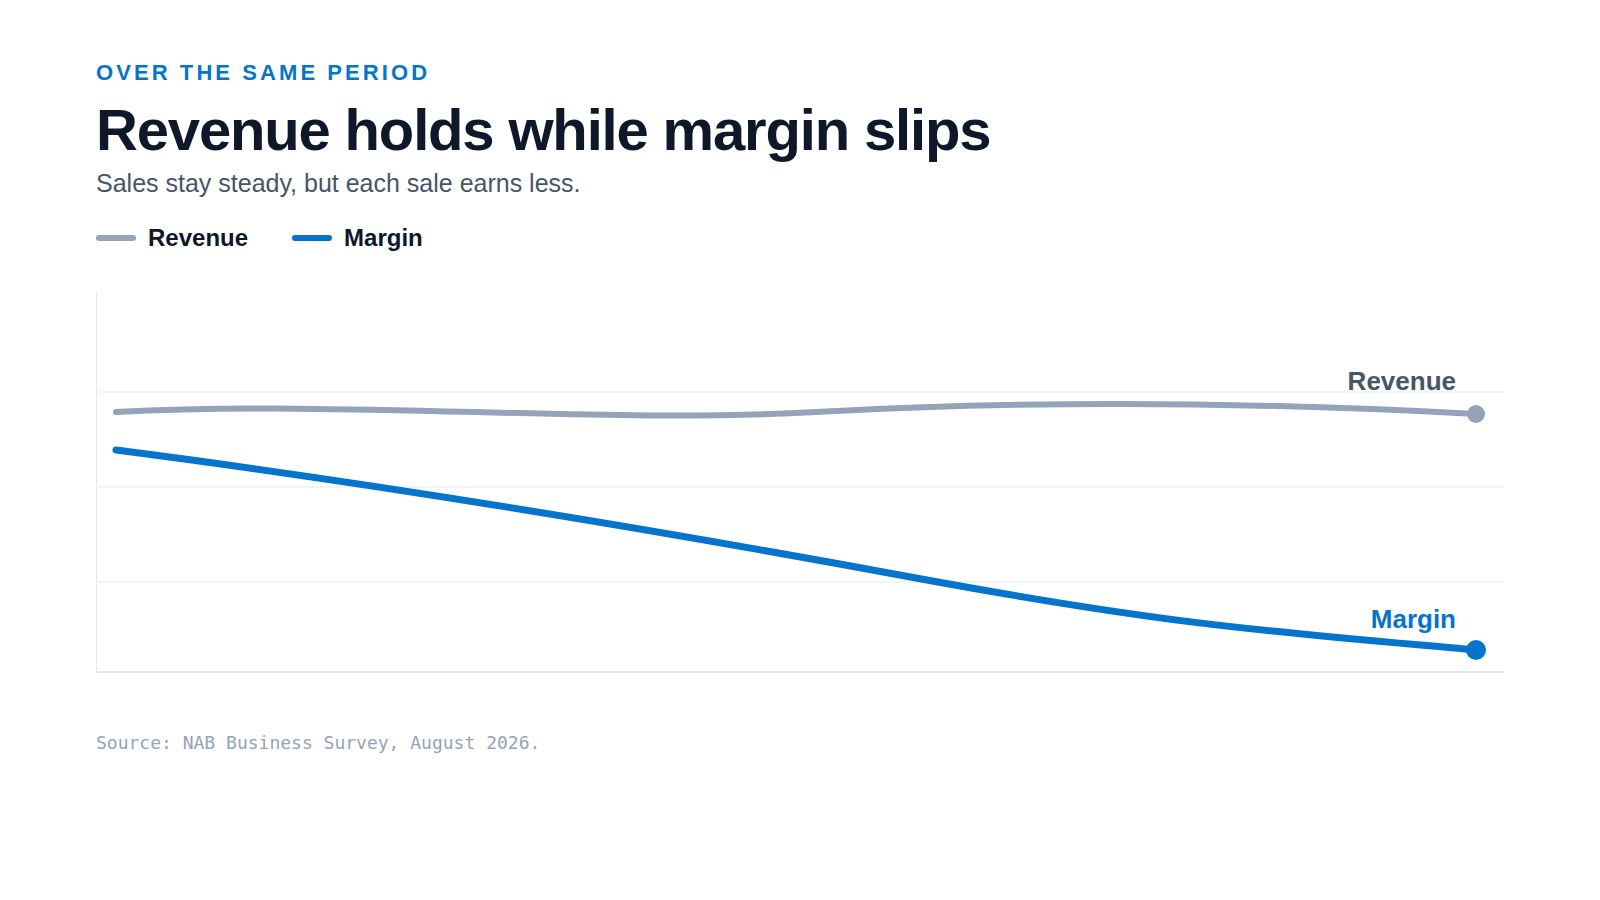
The fix is not more data. It is the right five numbers, joined and watched together, so cost and price move in plain sight next to revenue.
The dashboard tiles to add
Add these tiles and the pressure shows up early. Each one answers a question your revenue tile cannot.
- Gross margin percent: the headline. It answers whether each dollar of sales keeps more or less than it did last month.
- Cost growth versus price growth: the exact gap NAB is flagging. It answers whether your costs are outrunning your prices.
- Average selling price against unit cost: the same gap in dollars, tracked per product or per job.
- Forward orders: your demand pipeline. It answers whether the next few weeks are filling up or thinning out.
- Capacity utilisation: how hard the business is running. NAB put the national figure at 82.5% in August 2026, useful context for your own number.
Where the data already lives
You almost certainly hold every number above already. Gross margin comes from invoices and cost of goods. The cost side sits in purchase orders and supplier bills. Labour cost is in payroll. Selling prices are in your invoices or point of sale. You do not need a new system. You need those sources joined so the tiles update on their own, not once a quarter by hand.
Set thresholds before you need them
A tile only helps if it means something in a bad month. Decide the bands now, while you are calm. Pick a green range where margin is healthy, an amber range where it is slipping and worth a look, and a red range that triggers a conversation the same week. Do the same for the cost versus price gap and for forward orders. Set them against your own recent history, then let the dashboard colour the tile for you. When the red appears, you act on facts, not on a hunch.
What to do this week
Pick one product line or one service. Work out its gross margin for the last three months and write down this month's cost growth next to its price growth. If the cost number is bigger, you have found your squeeze, and you have found it early. That single check is the whole idea in miniature: watch margin and the cost to price gap, not just revenue.
When you want those tiles running for the whole business, from data you already collect, see the KPI Tracker page at meritvision.com.au/subs-services/kpi-tracker and see how we set it up.
Sources
- NAB Business Survey, August 2026: business conditions drop into negative territory (accessed 2026-09-10)
- Australian economy grew 0.4% in the June quarter (ABS National Accounts) (accessed 2026-09-10)
- Monthly Household Spending Indicator, July 2026 (ABS) (accessed 2026-09-10)