Your community satisfaction survey gives you one headline number, and everyone in the room reads it differently. Some see a pass mark, some see a problem, and few can say what it means or what to do next. This post shows how to read that score against the right benchmarks, find the services driving it, and set up a way to track change through the year. The aim is simple: leave the meeting with a plan, not just a slide.
What the 2026 results say
The 2026 Victorian results rolled out through winter, council by council. Local Government Victoria puts the statewide average for overall council performance at 58 out of 100. That figure is a benchmark, not a target. It tells you where the middle of the pack sits this year, so you can see whether your own result is above it, below it, or close to the line.
- 58 out of 100
- Statewide overall performance benchmark
- 64 out of 100
- Metropolitan average overall performance
- 400, selected at random
- Minimum residents surveyed per municipality
- 70 out of 100
- Example single-council result (City of Boroondara)
Read those numbers together and the picture changes. A score of 58 is the statewide average. Metropolitan councils sit higher on average, at 64 out of 100. The City of Boroondara reported 70 out of 100. One number on its own tells you very little until you know which group you belong to and what a fair comparison looks like.
A single score hides the story
An overall score is a summary of many smaller judgements. Underneath it sit category ratings across the things your council does: roads, waste, planning, customer contact and community consultation. Residents rate each area, and the headline rolls them up. Two councils can share the same overall score for very different reasons, so the useful work starts one level down.
The sample matters too. The survey is run by the Department of Government Services, with a minimum of 400 residents and ratepayers aged 18 and over per municipality, selected at random. That is enough to trust the overall direction, but small groups within the sample can move from year to year. Before you react to a one point shift, check whether it is a real signal or ordinary noise.
Read your community satisfaction survey against the right benchmarks
The most common mistake is comparing your result to the council next door. That neighbour serves a different community, with a different budget and a different mix of services. A fairer read lines your score up against three things: your metropolitan or regional group, the statewide average, and your own prior years. Those three give you position, context and direction in one glance.
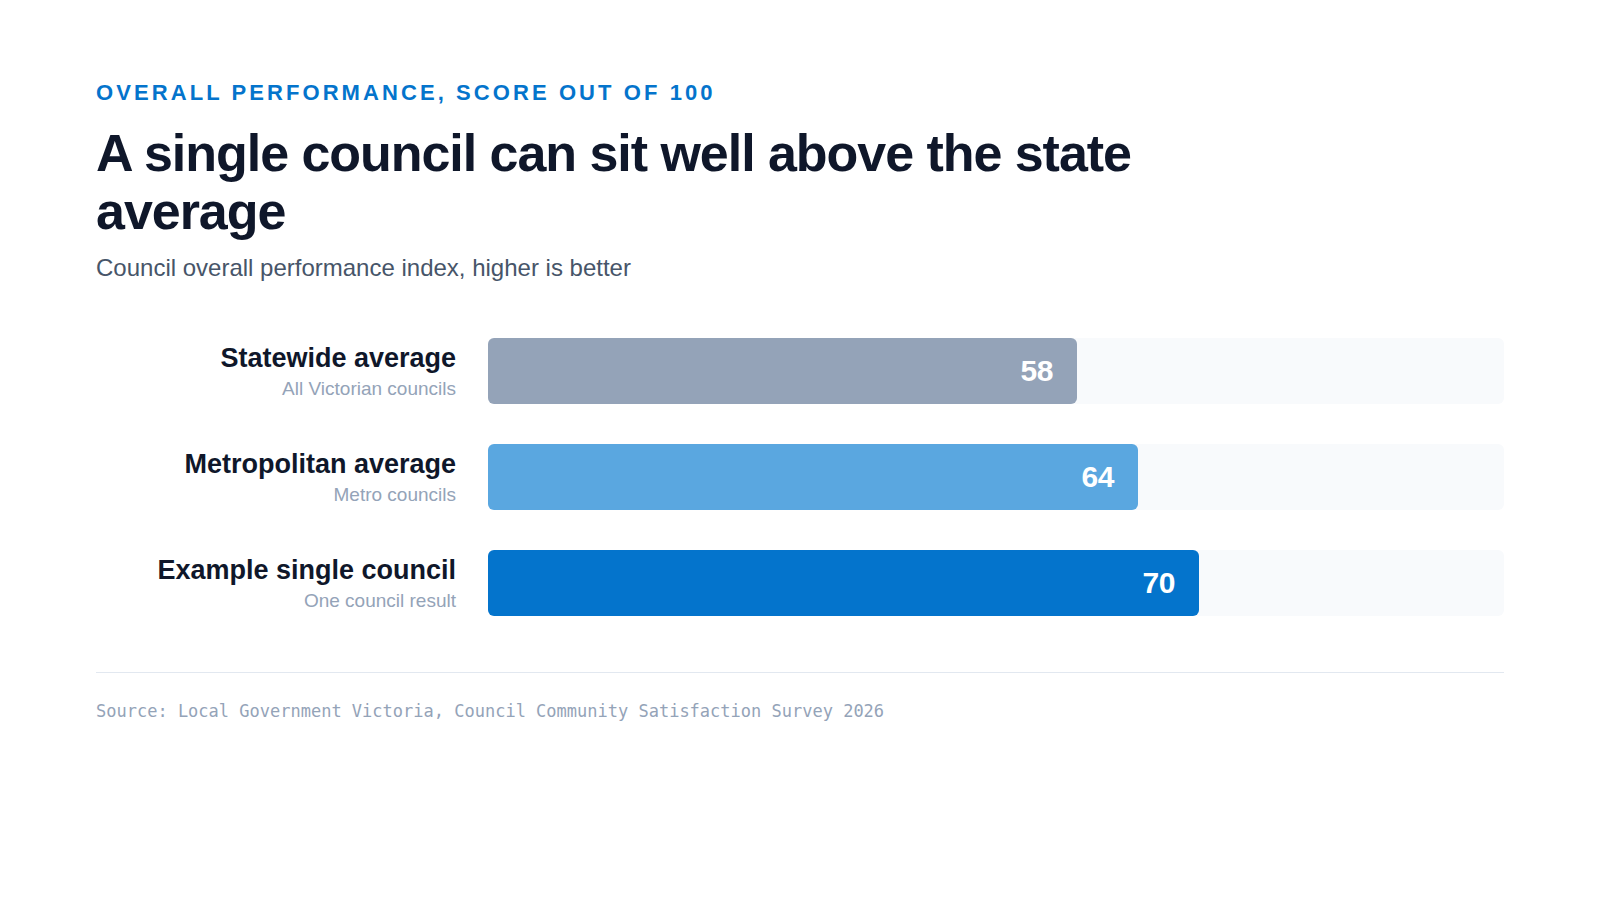
Boroondara's 2026 result shows why the comparison group matters. Its overall performance of 70 out of 100 sits above both the metropolitan average of 64 and the statewide average of 58. The same 70 would read differently in a regional group with a lower benchmark. Always name the benchmark before you judge the number, and be clear about it when you brief councillors.
Connect perception to what your council actually does
A score only becomes useful when you can link it to something you control. Join your survey categories to the operational data behind them, and the real drivers start to show:
- Customer contact ratings next to call wait times and request resolution times.
- Waste satisfaction next to missed bin reports and collection data.
- Roads and footpaths ratings next to maintenance backlogs and capital delivery.
- Consultation scores next to engagement reach and how often you close the loop with residents.
The City of Port Phillip shows the payoff. Its overall satisfaction rose from 6.9 to 7.1 out of 10, and safety as a concern fell from 21 per cent to 13 per cent over the past year, drawn from 900 face to face interviews. When perception moves like that, the next question is which actions moved it, and your operational data is where you find the answer.
Build a survey dashboard your councillors trust
Spreadsheets emailed after each survey do not survive contact with a council meeting. What holds up is a single view that shows the survey result, the right benchmarks, the trend across years, and the operational measures under each category. Councillors can see where they stand and what sits behind it, without waiting for a special report or a data request that takes a fortnight to fill.
Track change, do not just report a snapshot
The annual survey is a photo, not a film. If you only look once a year, you learn whether something worked twelve months after you tried it. Continuous or quarterly listening, through your own pulse checks, request data and complaint trends, lets you see movement sooner and correct course while it still matters. The annual result then confirms a direction you already knew.
Where to start before your next survey
You do not need to wait for the next round to begin. A few steps put you in a stronger position now:
- Pull your last three years of results and your comparison group benchmarks into one place.
- Map each survey category to the operational data that explains it.
- Agree the two or three areas most worth moving before the next round.
- Set a simple cadence so you track change through the year, not once a year.
Do that, and your next result becomes the start of a plan rather than the end of a report. If you want the dashboard built for you, MERIT Vision's KCPU service turns your survey score into a working view that your councillors can trust. Visit the KCPU service page at /subs-services/kcpu to see how we join your survey and operational data.
Sources
- Local Government Victoria, Council Community Satisfaction Survey program page (accessed 2026-09-09)
- City of Boroondara, 2026 Community Satisfaction Survey results (Mirage News) (accessed 2026-09-09)
- City of Port Phillip, 2026 Community Satisfaction Survey results show positive progress (accessed 2026-09-09)