Prices have fallen for five straight months and every source quotes a different number. If you own the board pack, a Power BI real estate dashboard that gives your team one honest read is worth more than another late night pulling figures out of three portals by hand. This post covers the KPIs it should track, why the indices disagree, the August 2026 Power BI features that help, and how to keep the whole thing trustworthy.
The market turned, and everyone has a different number
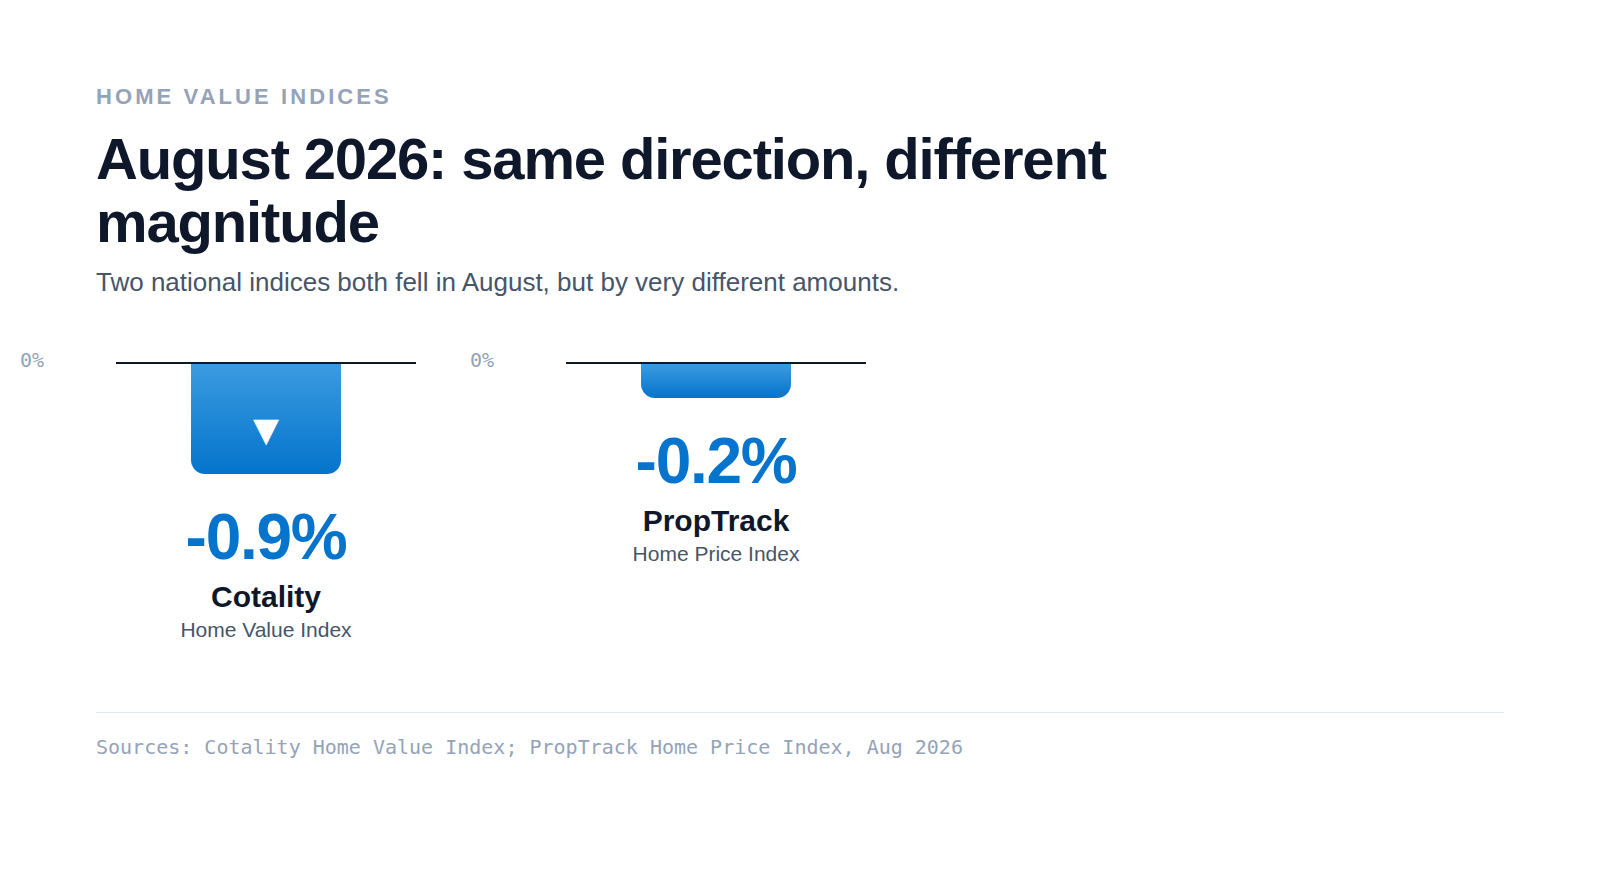
In August 2026, Cotality reported national dwelling values down 0.9% for the month, the fifth consecutive monthly decline, with the national median at $912,885 and the index 3.6% below its March 2026 peak. PropTrack put the same month at down 0.2%, still up 1.8% over the year. Same direction, different magnitude. That gap is why meetings keep reopening the same argument about whose number is right.
The other signals moved too. Auction clearance slid from 66% in February 2026 to the low 40% range by the end of July 2026. Rents kept climbing while vacancy sat near record lows. When each figure lives in a different portal, someone spends the night before the board pack stitching them together by hand.
What a Power BI real estate dashboard should actually track
A good dashboard tracks a small set of KPIs that answer the questions your board actually asks, each defined once so nobody argues about the definition later.
- Median days to sell: how long a typical property takes to sell. Lower means a faster market.
- Vendor discount: the average gap between the first asking price and the final sale price.
- Auction clearance rate: the share of auctions that sell on the day.
- Gross rental yield: annual rent as a share of the property value, before costs.
- Annual rental growth: how much rents have moved over the past year.
- Vacancy rate: the share of rental stock sitting empty.

- Dwelling approvals: new building approvals, an early read on future supply.
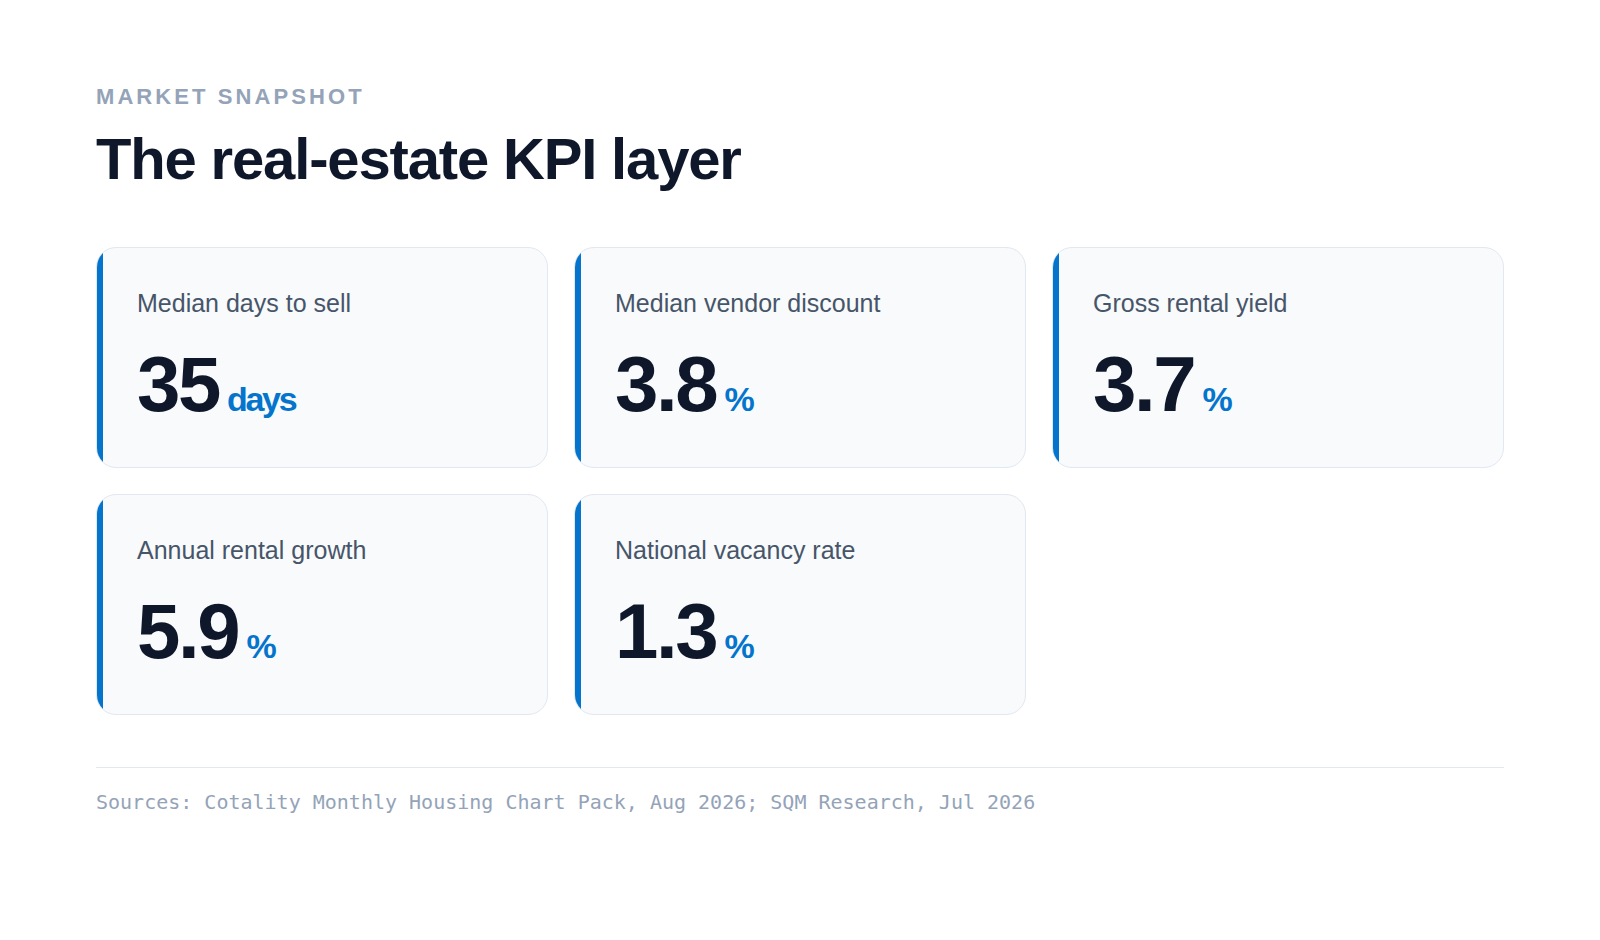
Here are current national benchmarks, taken straight from the source so the dashboard starts from agreed numbers.
- 35 days
- Median days to sell (three months to July 2026)
- 3.8%
- Median vendor discount
- 3.7%
- Gross rental yield
- 1.3%
- National vacancy rate (July 2026)
Why the indices disagree, and what a pipeline does about it
The indices disagree because they measure differently. Cotality and PropTrack both showed a fifth straight monthly national fall in August 2026, yet one landed at 0.9% and the other at 0.2%. Neither is wrong. They use different methods, samples and timing.
The fix is not to average them and hope. It is a pipeline that ingests each source on its own schedule, keeps every definition explicit, and reconciles the figures rather than blending them blindly. Listings, sales, rents, the Domain auction feed and ABS building approvals each arrive on their own cadence. In July 2026 the ABS reported total dwelling approvals fell 3.6% to 17,687, a supply signal worth its own scheduled feed. When the room disagrees, you show the working, not a single mystery figure.
Power BI on Fabric: the August 2026 features that matter here
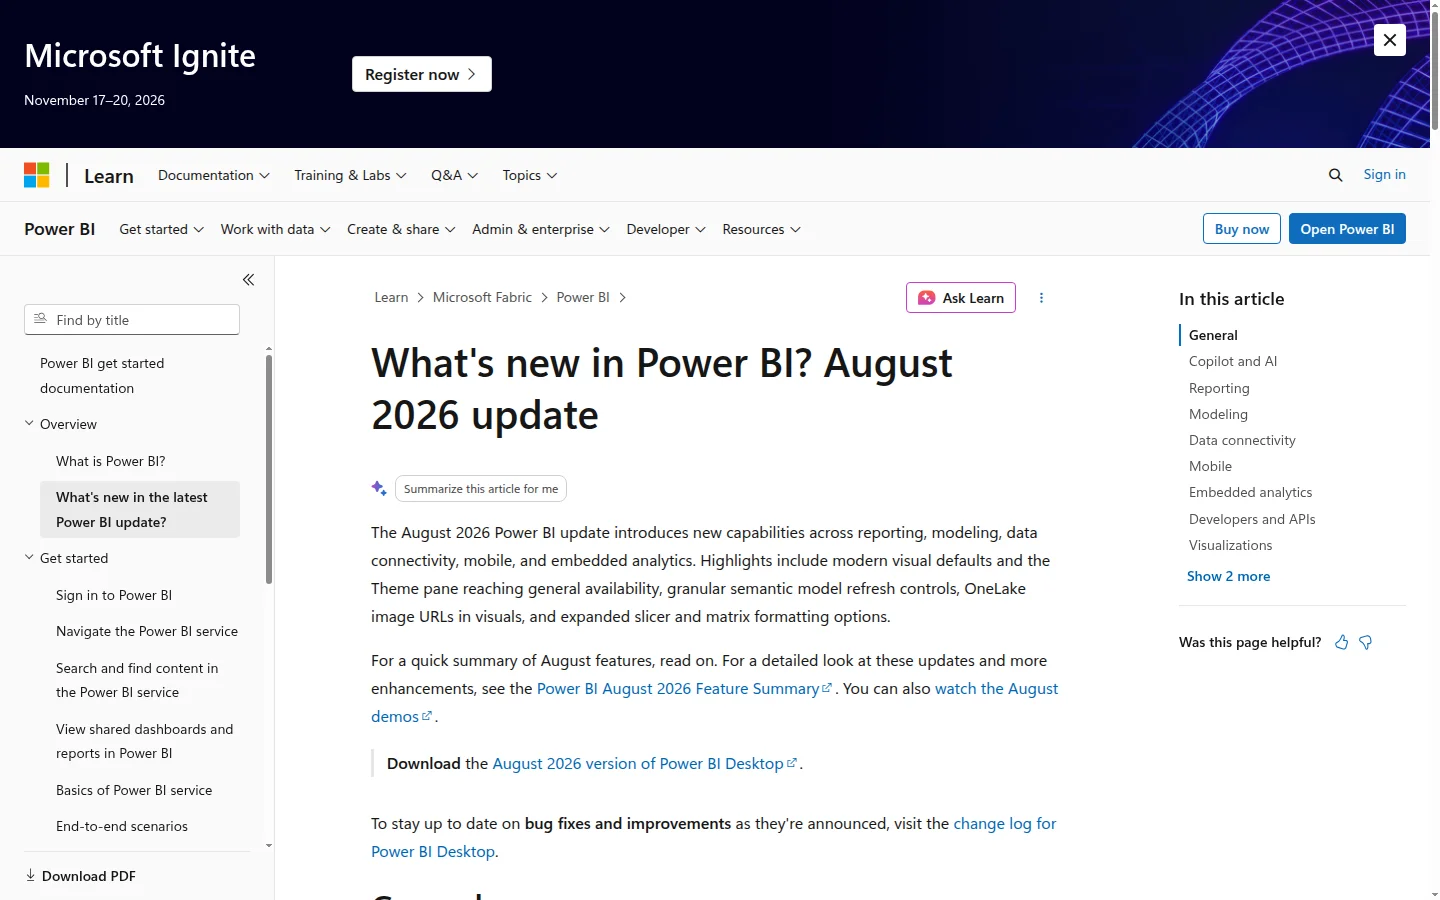
The August 2026 Power BI update on Microsoft Fabric added a few things that matter for this kind of reporting.
- Direct Lake calculated columns, in preview, let you define KPIs in DAX on Direct Lake semantic models without changing storage mode, evaluated at query time.
- More control over semantic model refresh, including refresh schema and data, sync schema only, or refresh data only, and refresh at the table level.
- OneLake file URLs in report visuals, now generally available, so images and reference maps can be sourced straight from OneLake.
Direct Lake is a storage mode in Fabric built to load large volumes of data into memory quickly from Delta tables in OneLake, which suits big listing and sales tables without a slow import step.
Keeping the dashboard trustworthy: monitoring and data quality
A dashboard is only as good as its last refresh. If a feed breaks quietly, the board sees stale numbers and nobody knows until it is too late.
Fabric workspace monitoring collects logs and metrics from pipelines, mirrored databases and semantic models into a read-only database you can query, with a 30-day retention period. On top of that, Microsoft Purview can profile, rule and scan the Lakehouse tables for data quality, provided the tables are in Delta or Iceberg format. Together they tell you a feed failed before the board does.
How MERIT Vision builds and runs this
What to do next
Book a walkthrough of RS AUS Dashboard and we will run the KPI set and the reconciliation pipeline on your own market data, so you can see one honest read before your next board pack is due.
Sources
- Cotality (CoreLogic) Home Value Index tracker, August 2026 (accessed 2026-09-07)
- Cotality Monthly Housing Chart Pack, August 2026 (accessed 2026-09-07)
- PropTrack Home Price Index, August 2026 (republished report) (accessed 2026-09-07)
- SQM Research National Vacancy Rates, July 2026 (accessed 2026-09-07)
- ABS Building Approvals, Australia, July 2026 (accessed 2026-09-07)
- Domain Auction Results (accessed 2026-09-07)
- What's New in the August 2026 Power BI Update, Microsoft Learn (accessed 2026-09-07)
- Direct Lake overview, Microsoft Fabric (accessed 2026-09-07)
- Workspace Monitoring overview, Microsoft Fabric (accessed 2026-09-07)
- Data Quality for Fabric Lakehouse in Purview Unified Catalog (accessed 2026-09-07)