Australian dwelling values fell in the June quarter 2026, the first quarterly fall since September 2022. If you own property reporting for a real estate group, a lender or a council, the market you report on has just changed direction. Your dashboard was built while values kept rising, and leadership learned to trust it. It may now be framing a falling market as growth, and that gap shows up fastest in front of a board.
Australian dwelling values just turned, and three measures agree
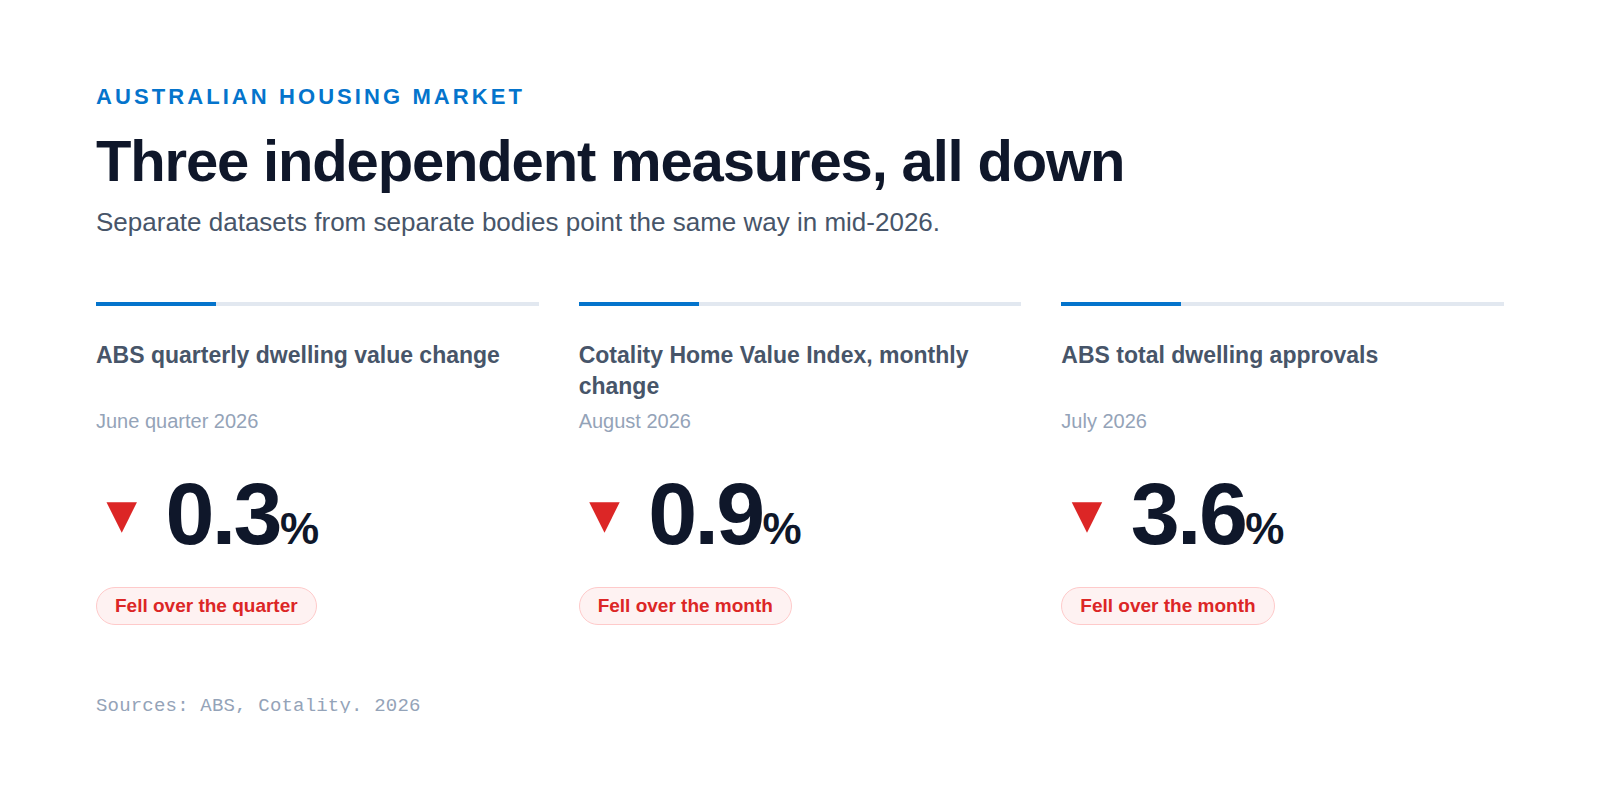
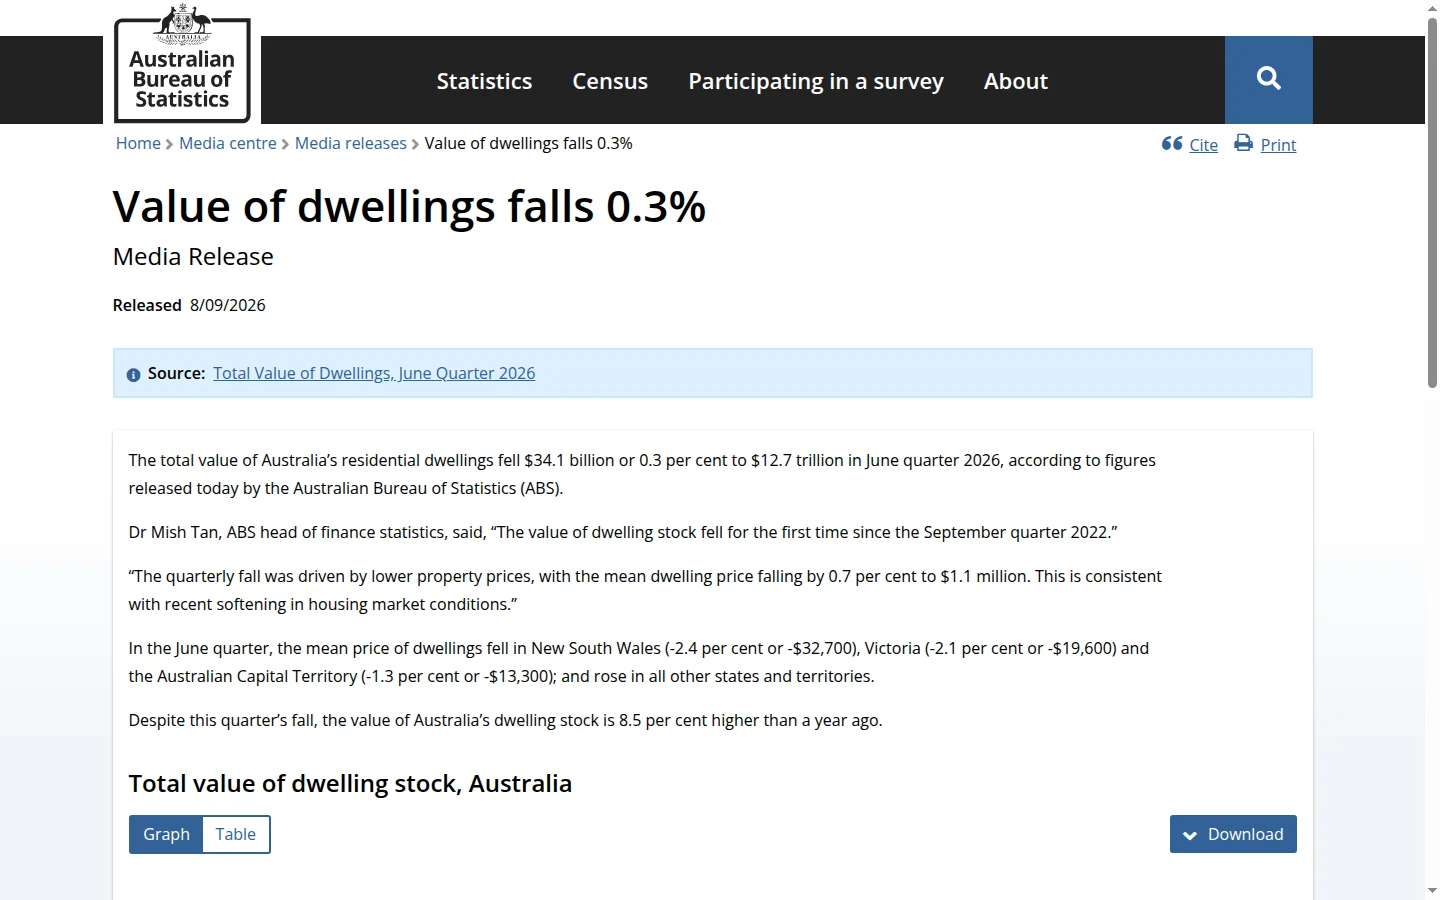
This is not one soft number. Three independent measures now point the same way. The ABS reported the total value of residential dwellings fell 0.3% in the June quarter 2026, a drop of $34.1 billion, and called it the first fall since the September quarter 2022. Cotality's Home Value Index fell 0.9% in August 2026, its fifth straight monthly decline. ABS building approvals for total dwellings fell 3.6% in July 2026.
One measure moving can be noise. A quarterly value series, a monthly index and a supply-side approvals series all turning down together is a signal. When the read is this consistent, the job of your dashboard changes: it has to show the turn clearly, not bury it under a year of gains.
A national headline now hides the real story
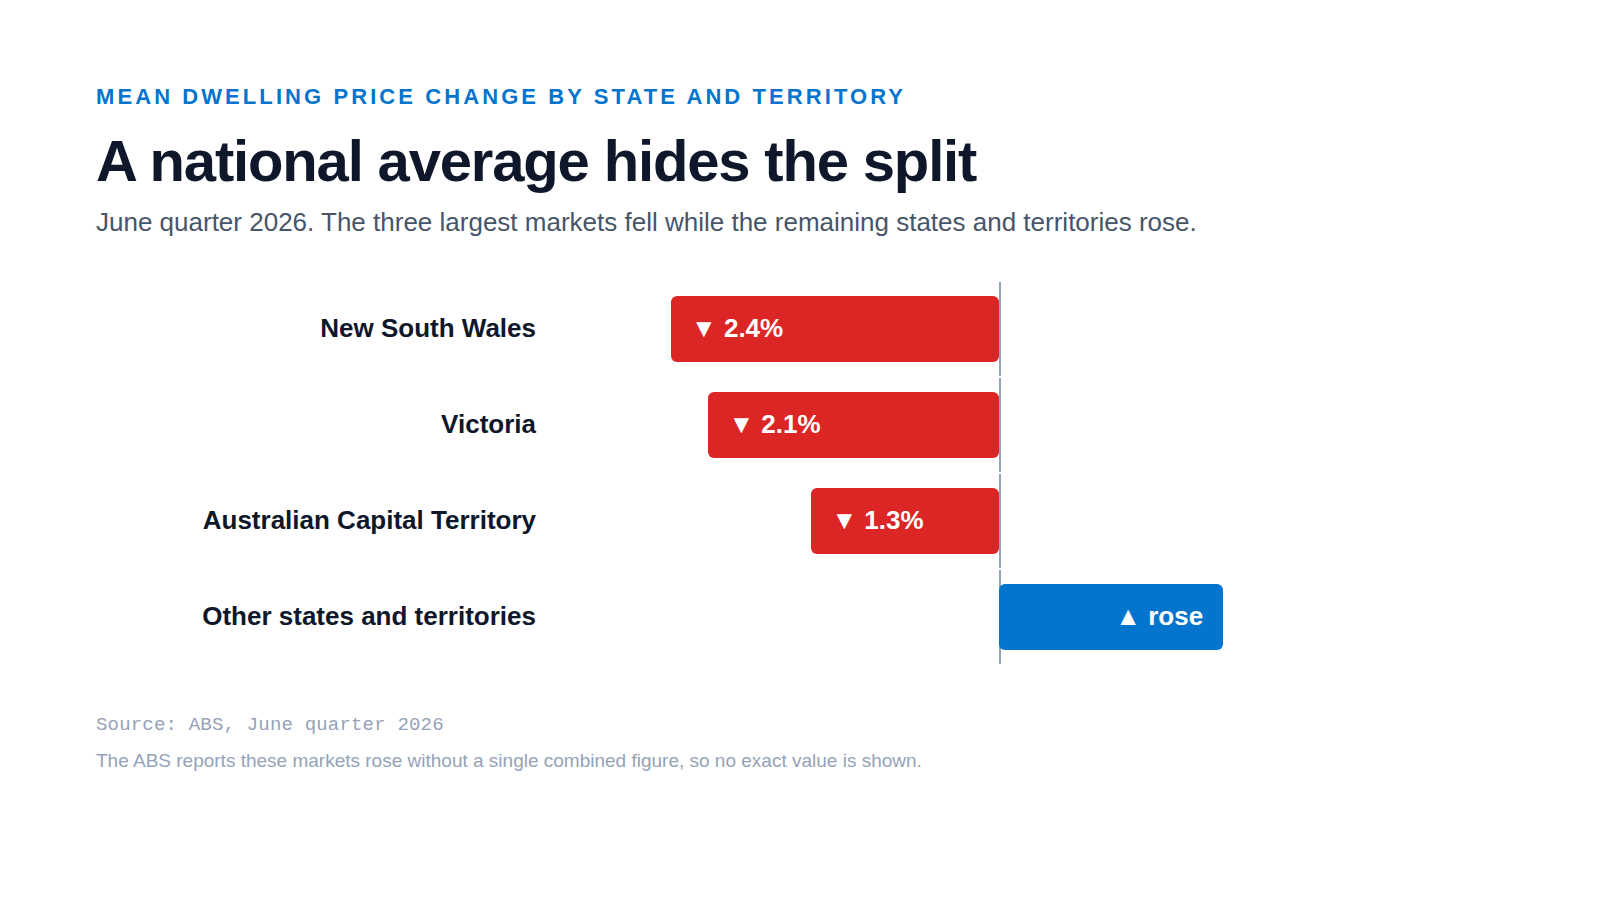
The national number is an average, and averages smooth over the places that moved most. In the June quarter, mean dwelling prices fell in three jurisdictions: New South Wales down 2.4%, Victoria down 2.1% and the Australian Capital Territory down 1.3%. All other states and territories rose. A single national figure blends those opposite movements into one calm line.
If your report leads with the national headline, a team in Sydney and a team in a rising state read the same slide and reach the wrong conclusion. State and territory splits are no longer a nice-to-have view. They are the difference between a dashboard that describes the market and one that misleads the people who act on it.
Year on year growth is now the wrong lead metric
Here is the trap. The stock value of Australian dwellings is still 8.5% higher than the June quarter 2025, even though the quarter itself fell. Lead your report with the annual figure and the story reads as strong growth. Lead with the quarter and it reads as a turning point. Both numbers are true. Only one of them tells leadership what changed this quarter.
Year on year growth lags because it carries three earlier quarters of a rising market inside it. At a turn, that is exactly the wrong lens. Report quarter on quarter direction as the headline, keep the annual figure as context, and add monthly momentum so you see the move between the slower quarterly releases.
- $12.7 trillion
- Total value of dwellings, June quarter 2026 (ABS)
- down 0.3%, first fall since September quarter 2022
- Quarterly change (ABS)
- 8.5% higher than June quarter 2025
- Year on year (ABS)
- down 0.9%, fifth straight monthly fall
- Cotality Home Value Index, August 2026
Add the signals that read a falling market
A dashboard built for a rising market answers one question: how much did we gain? A dashboard for a turning market answers a harder one: where is the market heading, and how fast? These are the signals to add so it can.
- Quarter on quarter direction as the lead figure, with the annual number kept as context, not the headline.
- State and territory splits, so a fall in New South Wales, Victoria and the ACT is not hidden by rises elsewhere.
- Monthly momentum from Cotality between the quarterly ABS releases, so a turn shows up in weeks, not months.
- Supply-side building approvals as an early read on the pipeline, given total dwelling approvals fell 3.6% in July.
- Sales volumes: Cotality estimates home sales are tracking 15.5% lower than the same time last year, a demand signal a value series alone will miss.
None of these are exotic. They are already public. The work is bringing them into one view that updates on time and agrees with itself.
Rework the pipeline so the numbers keep up
The catch is cadence. ABS dwelling values are quarterly. Cotality's index and ABS approvals are monthly. Each lands on its own date, in its own format, with its own revisions. A manual spreadsheet copes with that while the market drifts sideways. It breaks at a turning point, which is the one moment leadership needs the numbers to be right and current.
What to do before your next board pack
You do not need to rebuild everything this week. You need your reporting to reflect a market that is now moving the other way. Before the next board pack, run three checks: does the lead metric show quarter on quarter direction, not just annual growth; can leadership see the state splits behind the national figure; and does the view carry monthly momentum from Cotality so the turn is visible between quarters.
Have a property analyst open your RS AUS Dashboard and confirm it still reads the market correctly now that values are falling. If the answer is no, that is the one thing to fix before you present again.
Sources
- Value of dwellings falls 0.3% (ABS, Total Value of Dwellings, June Quarter 2026) (accessed 2026-09-10)
- Total dwelling approvals fall 3.6% in July (ABS, Building Approvals, July 2026) (accessed 2026-09-10)
- Monthly Housing Chart Pack, August 2026 (Cotality Home Value Index) (accessed 2026-09-10)