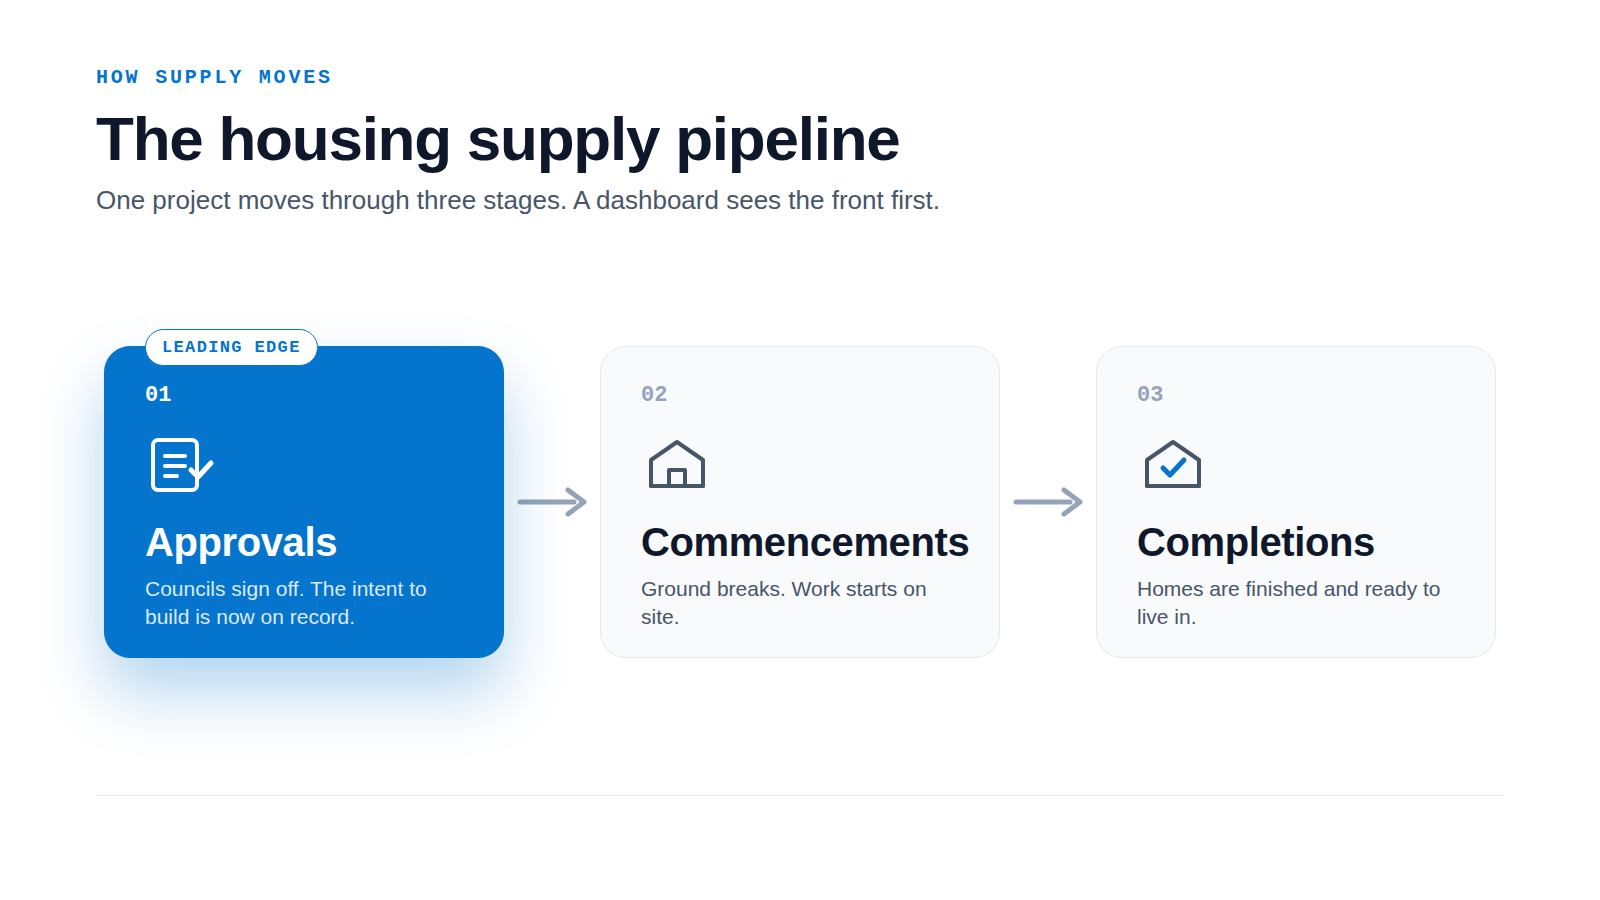
Your dashboard is good at prices, rents and sales volumes. Those numbers tell you where the market has been. They do not tell you what supply is coming. Building approvals do. In July 2026, total dwelling approvals fell 3.6% to 17,687, and that shift is a signal your board will want to read six to eighteen months out.
What the July 2026 building approvals release said
The Australian Bureau of Statistics released its figures for July 2026 on 1 September. Total dwellings approved fell 3.6% to 17,687 in seasonally adjusted terms. Private sector houses fell 4.2% to 10,199. Private sector dwellings excluding houses fell 0.4% to 7,119. One month does not make a trend, but the direction matters, and the split under the headline matters more.
Approvals for private sector houses fell 4.2 per cent in July, following a 0.8 per cent rise in June. Private other dwelling approvals fell 0.4 per cent, but remain at elevated levels with over 7,000 dwellings approved in this series for the second month in a row.
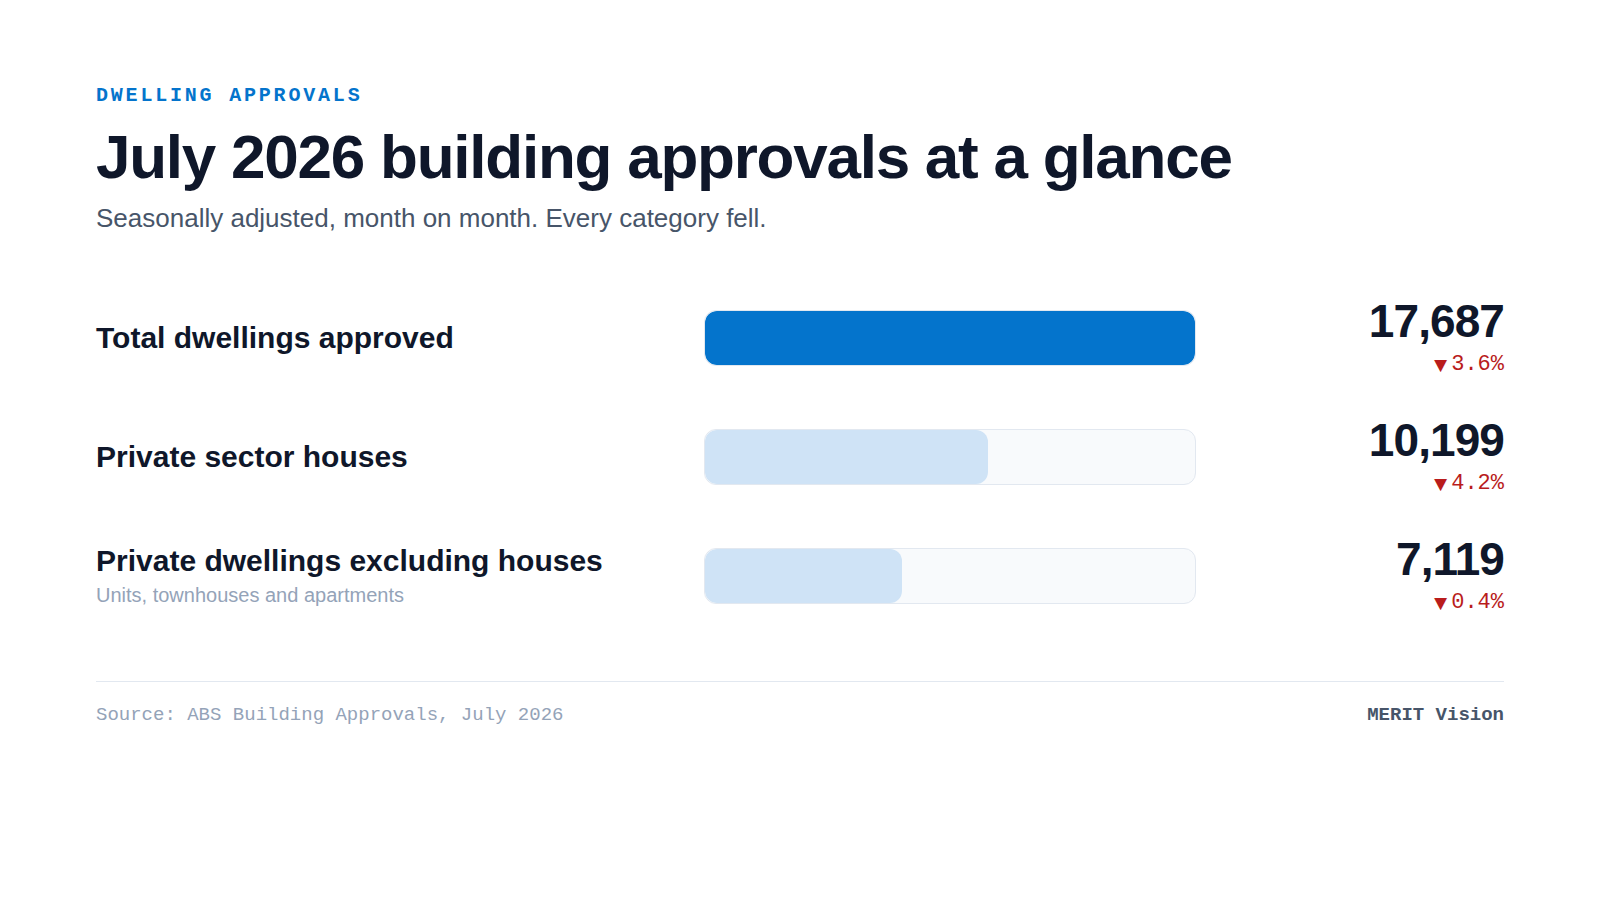
- Fell 3.6% to 17,687
- Total dwellings approved, July 2026
- Fell 4.2% to 10,199
- Private sector houses
- Fell 0.4% to 7,119
- Private dwellings excluding houses
- Fell 0.3% to $12.7 trillion
- Total value of dwellings, June quarter 2026
Why approvals lead and prices lag
Prices and values tell you what buyers paid for homes that already exist. Approvals tell you what could be built next. That is the difference between a rear-view mirror and the road ahead.
The contrast is clear in the same release cycle. In the June quarter 2026, the total value of Australia's residential dwellings fell 0.3% to $12.7 trillion, the first fall since the September quarter 2022, with the mean dwelling price at $1.1 million. That number describes stock already standing. Approvals describe intent to add to it. A dashboard that shows only value describes the past well and the future not at all.