Know it broke before your users do
Your team already runs quality checks. Tests that assert what you know can go wrong: this column is never null, that total always reconciles. They are useful, and they miss the problems you never thought to test for. Data observability fills that gap. It is monitoring for your data, not just your servers, and it tells you when something is off that no test was written to catch.
The difference shows up in how you find out. With quality checks alone, a broken pipeline often reaches you the wrong way. An executive asks why a number looks off, or why this morning's dashboard is blank, and only then does the team start digging. By then the report has been wrong for hours, and the trust you spent months building takes the hit.
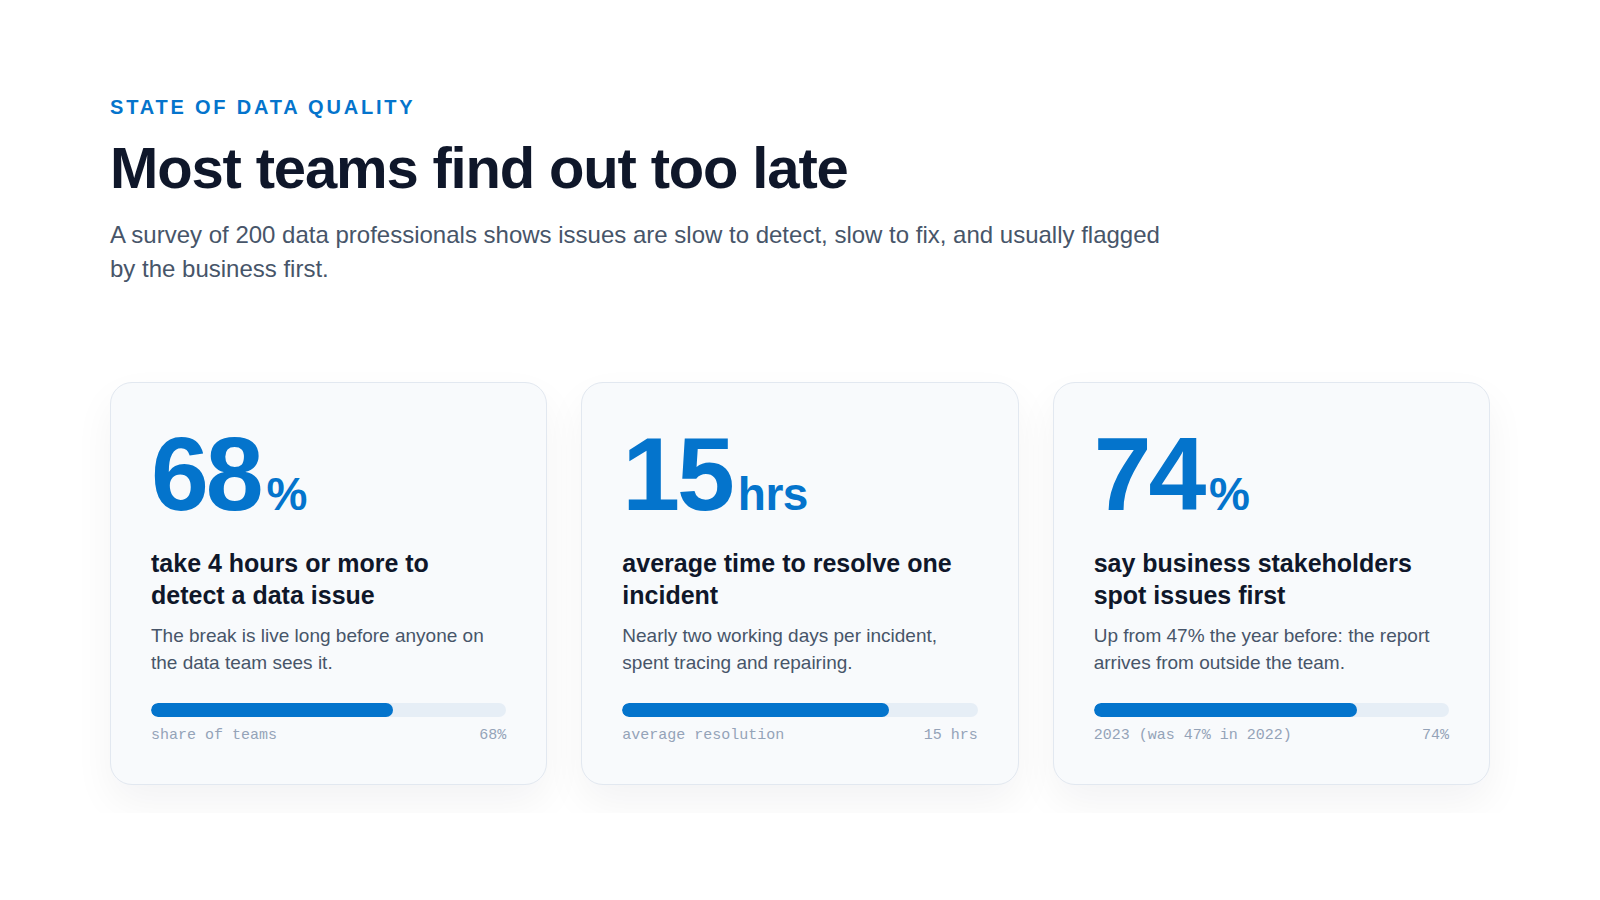
This is common. In a Monte Carlo survey of 200 data professionals, 74% said business stakeholders spot data issues first all or most of the time, up from 47% the year before. When the people reading your reports notice the problem before you do, you are firefighting, not monitoring.
What a broken pipeline actually costs
Late detection has a price. A Gartner estimate puts the cost of poor data quality at an average of USD 12.9 million a year per organisation. The day-to-day numbers are just as telling. The same Monte Carlo survey found the average organisation dealt with 67 data incidents a month in 2023, up from 59 the year before, and each incident took about 15 hours to resolve once someone noticed it.
- USD 12.9 million
- Average annual cost of poor data quality, per organisation (Gartner estimate)
- 67
- Data incidents per organisation each month, 2023 (Monte Carlo survey)
- About 15 hours
- Average time to resolve an incident once noticed
- 74%
- Say business stakeholders spot data issues first, 2023
Read those figures together. More incidents, found late, each taking most of a working day to fix, adds up to a team that spends its week reacting instead of building. The point here is not perfect data. It is knowing sooner, so a small problem stays small.
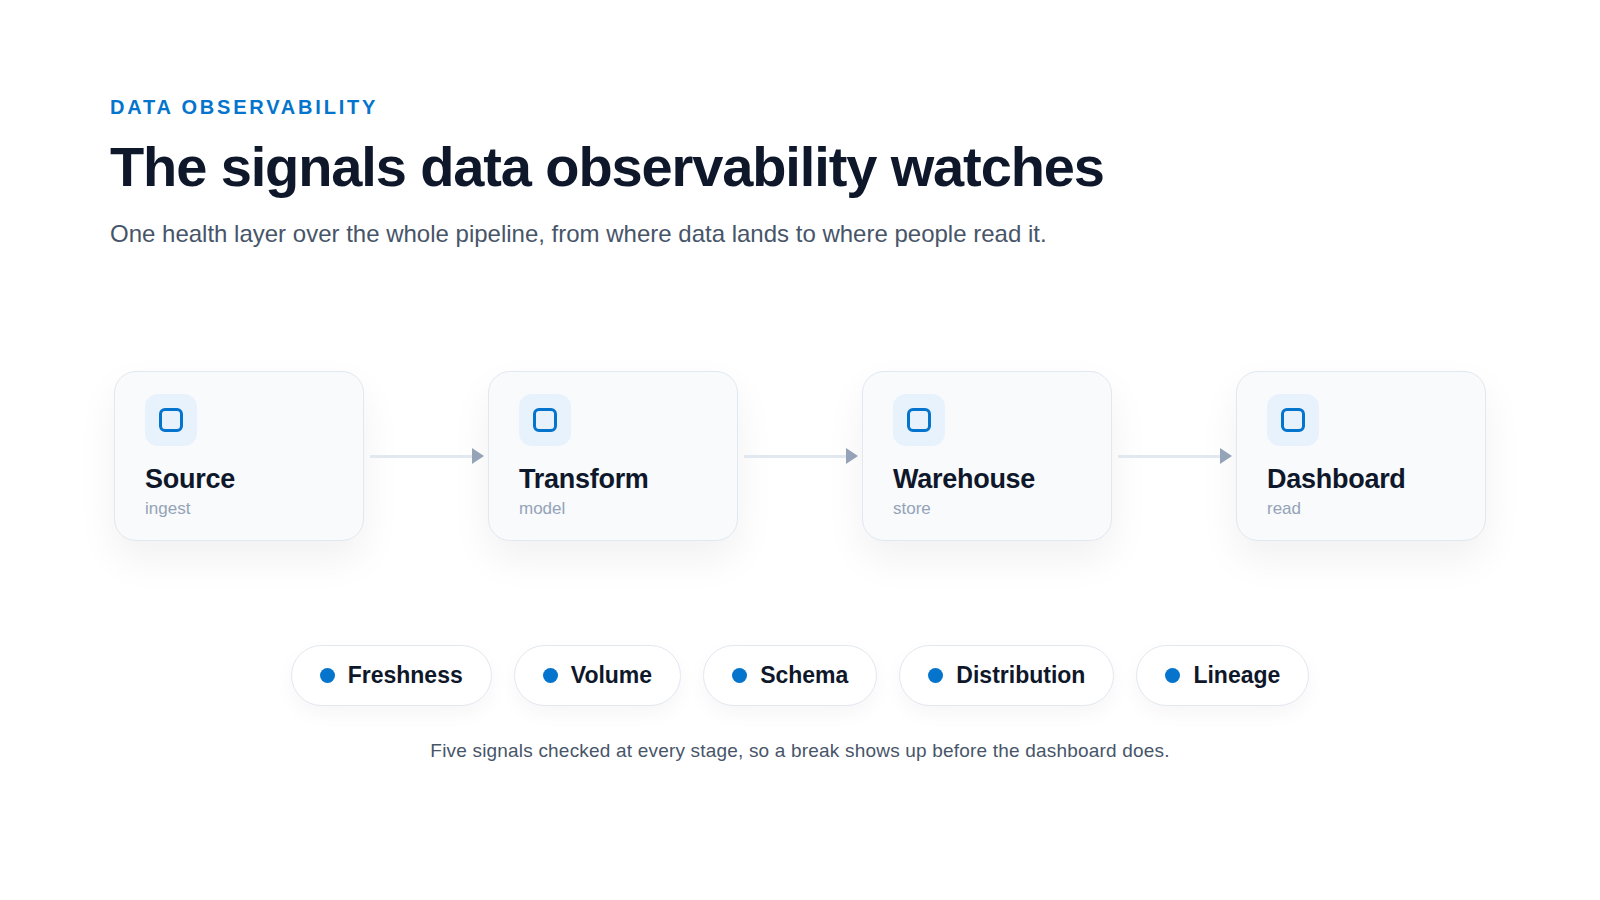
The signals data observability watches
So what do you actually watch? Barr Moses set out five pillars of data observability in 2020, and they still describe what every modern monitoring platform tracks. The original version of this post named four. Here are all five, in plain language.